In the fast-paced digital world, visuals are no longer just a nice-to-have – they’re a necessity. Infographics, in particular, have become essential tools for communicating complex information quickly and effectively. However, creating professional-quality infographics can be challenging, especially if you’re not a design expert.
This is where CourseAI comes in. With our advanced AI infographic generator, turning your text into stunning visual content is easier than ever. Let’s take a look at everything beginners need to do to produce infographics from start to finish with CourseAI.
Why Choose CourseAI’s Infographic Generator?
Creating infographics traditionally requires significant time, effort, and design expertise. Without the right skills or tools, the process can be frustrating and the results underwhelming.
CourseAI’s infographic generator AI eliminates these barriers, making it possible for anyone – regardless of experience level – to produce professional-grade infographics with just a few clicks.
Our AI-powered tool takes your text-based content and automatically generates visually compelling infographics that are informative and engaging. CourseAI’s tool provides the perfect solution for transforming your ideas into eye-catching visuals that resonate with your audience, whether you’re a teacher, a marketer, or a business owner.
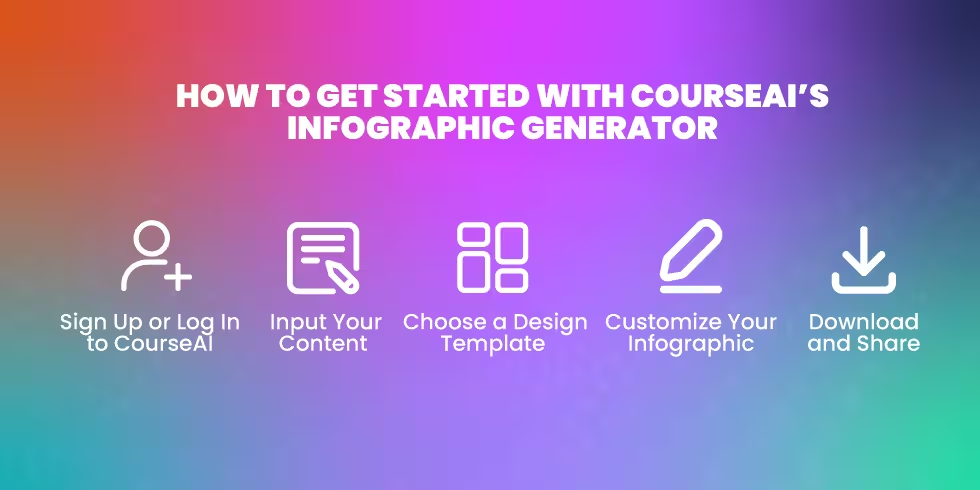
How to Get Started with CourseAI’s Infographic Generator

Using CourseAI’s AI infographic generator is simple and intuitive, even for beginners. Here’s how you can create your own infographic masterpiece in just a few steps:
1. Sign Up or Log In to CourseAI
To begin, visit CourseAI.com and sign up for an account or log in if you already have one. Once you’re in, you’ll have access to our suite of AI-powered tools, including the infographic generator AI.
We’ve designed our platform to be user-friendly, so you can start creating immediately without steep learning curves.
2. Input Your Content
Next, input the text or data you want to transform into an infographic. CourseAI’s advanced AI analyzes your content, understanding the key points and determining the best way to present them visually.
Whether you’re working with a data set or a narrative, our tool will generate a design that complements and enhances your content.
3. Choose a Design Template
CourseAI offers a wide selection of design templates tailored to various industries and purposes. Once our AI processes your content, it will suggest templates that align with your objectives.
Simply choose the one that best fits your needs, and watch as your content is transformed into a beautifully designed infographic.
4. Customize Your Infographic
While our AI does most of the heavy lifting, we know that personalization is key to making your visuals stand out. That’s why CourseAI allows you to easily customize colors, fonts, icons, and other elements of your infographic.
With our intuitive drag-and-drop interface, you can tweak the design to match your brand or personal style effortlessly.
5. Download and Share
Once you’re satisfied with your infographic, CourseAI makes it easy to download your creation in various formats (whether you need it for print, presentations, or online sharing).
With just one click, you can export your infographic and share it with your audience, ensuring that your message is communicated clearly and effectively.
Example Projects for CourseAI’s AI Infographic Generator
For Teachers:
- Visual summaries of complex subjects (e.g., historical events, scientific processes)
- Lesson plans and curriculum overviews
- Classroom rules or guidelines in infographic form
- Student performance or progress reports
- Interactive infographics for remote learning modules
For Marketers:
- Product comparison charts or feature highlights
- Social media engagement statistics visualization
- Campaign performance breakdowns
- Infographic-style case studies or success stories
- Visual content for email marketing or landing pages
For Trainers:
- Step-by-step training guides or manuals
- Employee progress tracking visualizations
- Skills development roadmaps
- Interactive infographics for e-learning modules
- Performance metrics dashboards for trainee assessment
For Business Owners:
- Annual or quarterly business performance summaries
- Visual representations of customer feedback or survey results
- Marketing or sales strategies and processes
- Project timelines or business growth roadmaps
- Employee onboarding infographics
Miscellaneous Usages:
- Nonprofit project impact summaries
- Personal blog post enhancements (e.g., how-to guides)
- Data-driven infographics for news or media publications
- Community outreach project overviews
- Family history or genealogy charts for personal projects
Transform Your Content with CourseAI
At CourseAI, we believe that everyone should have access to the tools needed to create high-quality content. Our AI infographic generator is just one example of how we’re making advanced design capabilities available to all.
Whether you’re looking to enhance a report, create marketing materials, or simply share information in a visually engaging way, CourseAI provides the tools you need to succeed.
Our platform continually evolves, incorporating the latest in AI technology to provide even more powerful and user-friendly tools. As the demand for visual content grows, CourseAI remains committed to helping you stay ahead of the curve, providing innovative solutions that make content creation faster, easier, and more effective.
Start Creating with CourseAI Today

Don’t let a lack of design skills hold you back. With CourseAI’s infographic generator AI, you can turn your ideas into stunning visual content in minutes. Join the growing community of users leveraging AI to create content that stands out and gets results.
Visit CourseAI.com today to start your free trial and see how our tools can transform your approach to content creation. Whether you’re a seasoned professional or just starting out, CourseAI has the tools to take your content from text to graphic masterpiece – quickly, easily, and affordably.

